OpenTelemetry Collectors for all
An open source gateway for observability data
Production software can be buggy or even fail. How do you figure out what’s going on, particularly if the issue relates to an emergent behavior of a deployed complex system, vs a specific bug in the code?
An electrical engineer has oscilloscopes and network analyzers to get a read on circuit behavior. Those instruments are incredibly helpful for working with complex circuits composed of many individual components.
Software engineers have observability tools. Those work by, first, instrumenting the codebase to emit certain data, then monitoring it. More on that later but, just for the moment, I want to zoom in on managing the monitoring tools. If you want to swap them out, or have more than one, do you need to reinstrument your codebase?
The answer is no, but you’ll need to implement a central gateway that receives that data from every source in the deployed system and ultimately fans out to your preferred suite of monitoring tools. We’re going to cover the details of building an open source gateway with custom components, all possible thanks to OpenTelemetry, a Cloud Native Computing Foundation incubating project.
Before we begin…
I recently built a custom exporter component for an OpenTelemetry Collector distribution. That process reminded me that building a custom Collector can be incredibly useful, and also that adding a custom component - also useful - does have its intricacies.
Somewhat unusually, my exporter handles both observability data and generic data, where the generic data is compatible with OpenTelemetry span attribute types.
Do not try this at home :) It was a creative solution to a particular need in a production software deploy. I’ve replicated a simplified version of the production solution, and the code is available on GitHub under an Apache 2.0 license. The goal is to stress test the dual-use exporter to get a read on its limitations, which I’ll cover in a future post. Here, we’ll stick to building the distribution itself.
First, though, a very brief introduction to observability. If you’re already an observability pro, skip to building a custom Collector.
Monitoring your software: observability
Analyzing software behavior is useful both for monitoring performance and for debugging issues. Deployed software typically executes a collection of function calls. The more complex the system, the more opportunity there is for function execution to deviate from intended patterns. The ability to peek into the internals of running software is known as observability, and observability is made possible by instrumenting the software to emit telemetry data.
Here, we’ll just touch on the basics of observability, dip into the OpenTelemetry ecosystem, then focus on building a custom Collector for handling data transport between the source and the backend.
Telemetry data
Telemetry data typically comes in three flavors: logs, metrics, and traces.
Logs
Logs selectively report information about the success or error of executing some part of the program. Logs generate volumes of text which can be scanned by eye as-is or organized in various ways to better reveal patterns.
Metrics
Metrics report event counts, aggregating individual event outcomes into a numerical measure. As aggregates, metrics are a powerful way to capture characteristics which are pre-determined to be worthy of monitoring. Simultaneously, that aggregation sacrifices event-specific information.
Traces
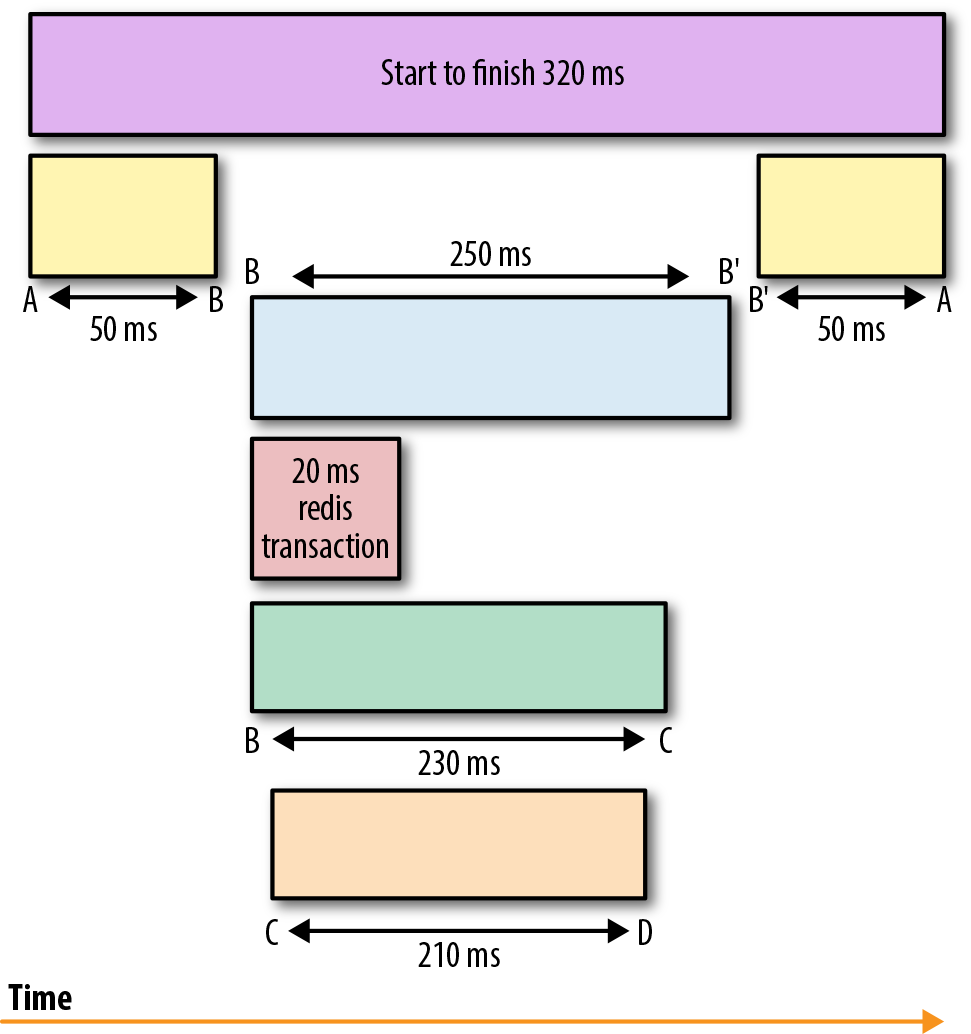
Traces collect granular information that includes the start and end times of instrumented functions. A timeline graph of stacked traces shows the order in which functions executed and the duration of each. Generally, a trace is a collection of spans, where the trace represents an overarching event and its spans represent contributing subfunctions. Often, metadata accompanies the trace to provide additional context for evaluating performance or for debugging.
Figure 1. From Distributed Systems Observability, Sridharan 2018
Instrumentation
The software itself is instrumented so that its functions emit telemetry data when executed. A variety of instrumentation options exist and many are compatible with using an OpenTelemetry Collector. One of those options is to just stay within the OpenTelemetry ecosystem, which we’ll do here.
OpenTelemetry is a suite of open source APIs, SDKs, and tools for standardizing observability tooling. These work with each of the standard telemetry data formats touched on earlier - logs, metrics, and traces - and the OpenTelemetry Protocol (OTLP) harmonizes handling of telemetry data in the scope of OpenTelemetry data pipelines.
A Collector of one’s own
The OpenTelemetry (OTel) ecosystem includes an option for handling multiple streams of telemetry data in one place: the OTel Collector. A gateway Collector enables nodes of a distributed system to target one intermediate Collector endpoint and any subsequent changes to processing data can be made (just) there, centralizing the handling of all nodes’ telemetry data.
The Collector is deployed in a location accessible to all emitting sources/nodes. It’s run as a binary distribution with a configuration file that defines the internal architecture of data pathways through the Collector, referred to as pipelines. Not only can the Collector be customized via configuration at deploy time, but the Collector’s binary distribution itself may be customized significantly. We’ll explore that in some detail after learning a bit more about the Collector.
OpenTelemetry Collector overview
The OTel Collector is a software component that handles ingest for OTLP encoded data, its processing, and ultimate export to designated targets. A Collector may be deployed as either an agent alongside a specific application/service, or as a standalone gateway that consolidates processing and export for distributed collections of input sources.
In either configuration, a Collector manages input streams, applies processing to designated streams, and fans out processed data to one or more export targets. Each such pathway through the Collector is a pipeline, and a Collector can have multiple pipelines. Those pipelines assemble basic components (receivers, processors, exporters) for transporting the data, alongside optional extensions and services that support robust transport.
The Collector also emits its own observability data, for monitoring its performance/health. When designed to act as a gateway for an application/service with high data flow rates, multiple identical Collectors can be set up downstream of a load balancer to improve reliability, resilience, and efficiency.
Collector distribution options
Pre-built distributions
A pre-built Collector distribution can be downloaded directly from OpenTelemetry’s Collector repo on Github. The choice of pre-built distribution establishes which components, services, and extensions are available for pipelines, though it doesn’t establish the pipelines themselves. Three basic flavors of pre-built distributions are available:
- core
- contrib
- kubernetes
The core distribution provisions a limited, general set of components. The contrib distribution provisions all components in the contrib collection. And the kubernetes distribution is optimized for deploy in the context of a kubernetes cluster.
Separately, the pipeline configuration(s) are defined in a manifest that’s used with the --config flag when running the distribution binary to deploy a Collector instance. We’ll go over that in the section on Collector config.
Using a pre-built distribution is convenient. For production systems, though, best practice is to customize the distribution to include only the required components. Let’s look at how to do that.
Custom distributions
There are two cases where custom Collector builds are the way to go -
First, building a custom distribution is best practice when using just a subset of components from a pre-built distribution: extraneous components increase the attack surface, posing an unnecessary security risk, and they also needlessly increase the size of the distribution binary.
Second, when components in the core and contrib collections don’t provide the required functionality, a custom Collector build is the only option.
We’ll be working in Go. Although OpenTelemetry SDKs and APIs are available in a range of languages, the builder tool for custom Collector distributions requires Go and custom components written in Go will be easiest to integrate into the distribution.
OpenTelemetry maintains a tool for generating custom builds: the Collector Builder. The builder tool is included in OpenTelemetry Collector releases with cmd/builder tags. For custom builds, you may choose to download just the builder component separately from the Collector itself. Here’s how you can do that for the version you’d need for macOS (ARM64) and OTel v0.125.0 (current as of 2025.05.07):
curl --proto '=https' --tlsv1.2 -fL -o ocb \
https://github.com/open-telemetry/opentelemetry-collector-releases/releases/download/cmd%2Fbuilder%2Fv0.125.0/ocb_0.125.0_darwin_arm64
chmod +x ocb
Once downloaded, an ocb directory will be added to the current directory, and guidance for using the builder can be accessed via:
./ocb help
At this point, the Collector builder is ready for customization. There are two possibilities at this stage —
Option 1: The goal of the customization is to limit which standard components will be available.
- All that’s needed at this point is a configuration file that details which components to include. Details in the section on Build config.
Option 2: The customization will include custom components not included in either the core or contrib distributions.
- The custom components need to be constructed before inclusion in the distribution build config/manifest. Details in the section on Building custom components.
Both options require a builder manifest that identifies which components to include in the resulting Collector distribution. With the builder manifest file as builder-config.yaml and the builder binary at ./ocb, the custom Collector distribution is built as:
./ocb --config builder-config.yaml
The builder manifest will specify a name and path for the target folder which will contain the binary for the new distribution as well as the program files from which the binary was built. Now, let’s take a closer look at the specific components that make up Collector pipelines.
OpenTelemetry Collector components overview
Basic OpenTelemetry Collector components are of three types:
- receivers
- processors
- exporters
The OTel Collector distribution selected determines which components can be included in the pipelines of deployed Collector instances. You can also build your own components and include those in a custom Collector distribution.
Building custom components
Custom components are built from scratch: there’s no official builder utility as of 2025.05.12.
The APIs for receiver, processor, and exporter components:
- opentelemetry-collector/receiver/receiver.go
- opentelemetry-collector/processor/processor.go
- opentelemetry-collector/exporter/exporter.go
Any component referenced in the distribution manifest will need a NewFactory() function that returns a Factory interface that’ll enable production of that specific component for use in the Collector. Here’s an example for exporters:
func NewFactory(cfgType component.Type, createDefaultConfig component.CreateDefaultConfigFunc, options ...FactoryOption) Factory {
	f := &factory{
		cfgType:                 cfgType,
		CreateDefaultConfigFunc: createDefaultConfig,
	}
	for _, opt := range options {
		opt.applyOption(f)
	}
	return f
}
createDefaultConfig and cfgType are required for any component Factory. These define basic characteristics, such as whether the component will act as a receiver, processor, or exporter. Beyond those, the specific options applied will define functionality, and those are different for each component type. The specific options define the range of possibilities for customization. For example, a custom exporter might use the exporter.WithTraces() option, which takes CreateTracesFunc as an argument. The CreateTracesFunc allows for a customized function that consumes traces, and the desired export action can be defined there.
As an example, the code for the custom exporter built for the otelex project that prompted this post can be found in internal/spattex/bigquery.
A useful reference for building custom Collector components is the collection of custom components in the opentelemetry-collector-contrib collection.
Adding custom components to a Collector
The Collector builder manifest itemizes which components to include in the distribution. If the custom component is published as a module visible to Go tools, you can reference it similarly to existing/standard components from core or contrib.
If the custom component is local, you can reference it by its full path. So long as the distribution library build is run locally, or the component files are exported to the filesystem of the deploy environment, the component will be accessible and will be incorporated into the distribution.
Custom exporter targeting a BigQuery table
The goal for the example custom exporter is to handle non-OTLP data packaged into span attributes. The exporter unbundles span attributes and generates value-rows formatted for export to a target table via API request. The formatting to satisfy the target table schema requires customization, as does the implementation of API requests to export the formatted data.
To export non-OTLP formatted data, exporter.WithTraces() is used. It takes as an argument a CreateTracesFunc where custom actions for ‘pushing’ traces can be defined with the expectation of returning an error type. The OTLP traces are consumed by this function, with no expectations attached to retaining their OTLP format.
In otelex, the custom exporter component targets a BigQuery table. The exporter:
- verifies that each span’s attributes (key-value pairs) align with the target database schema
- extracts the span attribute key-value pairs to row-like maps
The maps are equivalent to rows for export to BigQuery, and batches of row-maps are exported for insertion into the receiving table, tuned to align with BigQuery ingest and table insertion quotas.
This otelex project was inspired by a production data pipeline that handled both observability and client usage data. The approach allowed for fewer components, making for a simpler system. The follow on goal is to interrogate the limits of this implementation, and I’ll cover that in a future post.
Why a custom exporter, and not a custom processor?
The Collector is designed to process OTLP encoded data. Exporting to a target that doesn’t expect OTLP data requires unbundling. Doing that decoding/unbundling at the last stage before export minimizes the footprint of non-OTLP data within the Collector. I don’t have any data to show that this is necessary or even useful. Even if it’s not, it feels cleaner to structure it thus.
Configuration files
Build config
This is for the Collector distribution binary.
The ocb utility for building custom Collector distributions requires a manifest that tells it which components to include. (The composed pipelines aren’t specified by the manifest — just the components that will be available for building pipelines.)
Here’s an example build manifest from OpenTelemetry:
dist:
  name: otelcol-dev
  description: Basic OTel Collector distribution for Developers
  output_path: ./otelcol-dev

exporters:
  - gomod:
      # NOTE: Prior to v0.86.0 use the `loggingexporter` instead of `debugexporter`.
      go.opentelemetry.io/collector/exporter/debugexporter v0.125.0
  - gomod: go.opentelemetry.io/collector/exporter/otlpexporter v0.125.0

processors:
  - gomod: go.opentelemetry.io/collector/processor/batchprocessor v0.125.0

receivers:
  - gomod: go.opentelemetry.io/collector/receiver/otlpreceiver v0.125.0

providers:
  - gomod: go.opentelemetry.io/collector/confmap/provider/envprovider v1.18.0
  - gomod: go.opentelemetry.io/collector/confmap/provider/fileprovider v1.18.0
  - gomod: go.opentelemetry.io/collector/confmap/provider/httpprovider v1.18.0
  - gomod: go.opentelemetry.io/collector/confmap/provider/httpsprovider v1.18.0
  - gomod: go.opentelemetry.io/collector/confmap/provider/yamlprovider v1.18.0
In otelex, the custom exporter component is included in the builder_config.yaml with a local path as it’s not a published Go module (more on that in Docker deploy):
exporters:
  - gomod: "github.com/msyvr/otelex/internal/spattex/bigquery v0.1.0"
    path: "msyvr/o11y/otelex/internal/spattex/bigquery"
Collector config
This is for the deployed Collector instance.
At this point, the Collector distribution is prepared, whether prebuilt or customized. The distribution determines which components (and some other options) are available for building pipelines. Those will be composed into pipelines in the Collector configuration file, in a standard format:
receivers:
  otlp:
    protocols:
      grpc:
        endpoint: 127.0.0.1:4317
      http:
        endpoint: 127.0.0.1:4318

processors:
  batch:

exporters:
  otlp:
    endpoint: otelcol:4317
  custom_exporter:

extensions:
  health_check:
  pprof:
  zpages:

service:
  extensions: [health_check, pprof, zpages]
  pipelines:
    traces:
      receivers: [otlp]
      processors: [batch]
      exporters: [otlp]
    metrics:
      receivers: [otlp]
      processors: [batch]
      exporters: [otlp]
    logs:
      receivers: [otlp]
      processors: [batch]
      exporters: [otlp]
Local grpc and http receiver ports may be specified as localhost instead of 127.0.0.1.
For Docker deploys, reference the ports as:
receivers:
  otlp:
    protocols:
      grpc:
        endpoint: my-hostname:4317 # Same hostname as in the docker run command
Deploying a Collector instance
The manifest is provided to the --config flag when the run command for the Collector instance is executed. Locally, run the binary at otelcol/custom-build with manifest at /path/to/collector-config.yaml as:
otelcol/custom-build --config /path/to/collector-config.yaml
Validate the config file: Running the above with
validatepreceding--configwill check that the provided config file aligns with a valid OpenTelemetry Collector configuration.
Chained config flags are merged: Multiple
--configflags will be merged into a single configuration; if the merger doesn’t yield a complete configuration, the command will error.
Alternatives for loading the configuration include —
environment variables:
otelcol/custom-build --config=env:OTELCOL_CUSTOM_CONFIG
YAML strings:
otelcol/custom-build --config="yaml:exporters::custom-exporter"
external URLs:
otelcol/custom-build --config=https://my-domain.com/collector-config.yaml
Docker deploy
When the Collector is deployed using a pre-built Docker image otelcol-custom:latest, the manifest file can be mounted as a volume on launch:
docker run -v /path/to/collector-config.yaml:/etc/otelcol-custom/config.yaml otelcol-custom:latest
The image needs to be built first, of course. This deserves a note for the case where unpublished components need to be included. The component may be unpublished for a reason and a multistage Docker build can be used to avoid exposing the custom component files.
The image will be built locally in the environment where the component files can be accessed directly, so they can be copied into a (non-final) stage of the Docker build. There, the distribution that includes that custom component is built, referencing the files. However, a subsequent stage involves copying in only the distribution binary. That way, the final (persistent) image exposes the distribution binary without exposing the individual component.
FROM golang:alpine AS builder

WORKDIR $GOPATH/src/msyvr/otelex

COPY go.mod go.mod
COPY go.sum go.sum
COPY tools.go tools.go
COPY buildfix.go buildfix.go
COPY config/builder-config.yaml config/builder-config.yaml
COPY internal/spattex/bigquery internal/spattex/bigquery

RUN --mount=type=cache,mode=0755,target=/root/.cache/go-build \
    GOARCH=amd64 GOOS=linux CGO_ENABLED=0 go build -o /tmp/ocb \
    go.opentelemetry.io/collector/cmd/builder

RUN /tmp/ocb --skip-compilation \
    --config config/builder-config.yaml

RUN --mount=type=cache,mode=0755,target=/root/.cache/go-build \
    GOARCH=amd64 GOOS=linux CGO_ENABLED=0 go build -o /tmp/bq/bq .

# Build the final (persistent) image
FROM alpine
RUN adduser -S -u 10000 otelex
COPY --from=builder /tmp/bq/bq /bq
COPY config/otelcol-config.yaml otelcol-config.yaml
ENTRYPOINT ["/bq"]
CMD ["--config", "otelcol-config.yaml"]
Visualization
Visualization options include open source tools and third party providers. Here, we’re just keeping it simple and running a Jaeger Docker image locally:
docker run -d --name jaeger \
  -e COLLECTOR_OTLP_ENABLED=true \
  -p 16686:16686 \
  -p 14317:4317 \
  -p 14318:4318 \
  jaegertracing/all-in-one:1.41
Nothing to see here…
Once the Collector is deployed, it’s ready to receive traces directed to its ingest ports, per the receivers defined in the Collector manifest. Logs will indicate that the Collector is ready to receive, but the only signs of life in the absence of incoming telemetry data will be those provided by meta-telemetry from any health checks or other services set up for monitoring the Collector itself.